Friday, March 22, 2024

Sociological Madness in March

Culture and Socialization within Organizations


Besides Loyola University's motto "Created By Culture" there are many ways that the NCAA basketball tournament can be connected to sociology.

Loyola really did try to create a culture that affected the basketball success.  They implemented norms and language that reinforced and reshaped the values of the program.


http://www.chicagotribune.com/sports/college/ct-spt-loyola-basketball-porter-moser-haugh-20180216-story.html
“It’s amazing the way he has gotten us all to believe in his vision for us,’’ Custer said. “The big thing this year is the buy-in to his style of play. We’re selfless.’’  This was the cultural impact Moser hoped for when he came up with the idea for the wall shortly after arriving at Loyola in 2011.


Shared Meaning, Cultural Production and Institutions
http://college.usatoday.com/2012/03/17/symptoms-of-march-madness-spreading/
Rick Eckstein, a sociology professor at Villanova University, contends that a lot of March Madness might just be hype: “There is a lot of cultural pressure to ‘act out’ during certain key sporting spectacles. Usually this means buying certain products (often food) and treating the sporting event as another commodity to be consumed in excess....He says that this cultural pressure is derived from sources as diverse as the media, the workplace, religious institutions and schools. “Keep in mind, though, that for all of this attention paid to March Madness, a lot of people simply don’t care about it at all,” Eckstein says. “However, the barrage of cultural images exaggerates the overall social appeal of this sports spectacle.”

Race and Shared Meaning
https://theundefeated.com/features/why-are-so-many-ncaa-basketball-walk-ons-white/
With so much black identity and manhood tied up in the game, it goes against the cultural grain for players to seek out a low-status position....Our whole athletic socialization is different,” said Moore, the University of Texas professor. “It’s more central to our sense of self-worth. That comes from our family, teachers, pastors at the church: ‘You’re a basketball player.’ And so for me at 18 or 21 to say I’m going into coaching, what I’m saying is my basketball career is over. And it ain’t supposed to be over....Walking on has this stereotype that it’s something embarrassing or looked down upon."

Social Institution of College and Shared Meaning
https://www.bloomberg.com/news/features/2017-03-13/march-madness-more-students-apply-to-schools-that-break-brackets
Interesting study of how a cinderella story affects a college.  Breakdown with data and graphs.

https://www.theatlantic.com/education/archive/2017/03/the-march-madness-application-bump/519846/
Secondary source with a number of links to primary data about the positive effects of winning an upset.  "...schools that beat performance expectations during March Madness receive a bump not only in public awareness, but also in the number of applications they receive."


These differences in word choice might seem small, but they can have big consequences.

Here is the story from public radio about a study of basketball announcers:  


Here is an excerpt of the story which features sociologist Rashawn Ray:

two sociologists recently published a study that looked at a decade's worth of March Madness broadcasts, and they found that sometimes racial bias sounds like this:

"That’s a tough matchup for JJ Redick on the glass. Redick not known as a rebounder. Tasmin Mitchell much stronger, bigger and more athletic."

"I mean, of course, we can highlight some of these bigger comments that most people would consider to be racist," says Dr. Rashawn Ray, who teaches sociology at the University of Maryland, College Park. "But instead, what we were highlighting, in many ways, is implicit bias and the subtle ways that race actually operates, when it comes to talking about some of these historical stereotypes, about what it means to be Black and physically superior and, at the same time, intellectually inferior, and, on the other hand, what it means to be lighter-skinned or white."

Same Action, Different Description

Dr. Ray and his co-author Dr. Steven Foy, of the University of Texas, Rio Grande Valley, transcribed 52 men’s college basketball broadcasts, including 11 championship games. They were looking at the ways broadcasters talk about players of different skin tones, and whether racial bias was at play.

The original research article from U of Chicago is called Skin in the Game: Colorism and the Subtle Operation of Stereotypes in Men’s College Basketball and is published in the American Journal of Sociology 2019.


Gender, Sexism, Cultural Production and Institutions
https://thesocietypages.org/socimages/2012/03/21/gender-and-espns-coverage-of-march-madness/
Interesting discussion of cultural production; how the hype around men's basketball creates a self-fulfilling prophecy.  "...by making the men’s tournament resources more engaging and informative, it reinforces the sense that the women’s tournament is a side event, not worth the same level of attention as the men’s. As she points out, ESPN probably devoted less time and energy to the women’s tournament website because they assume fewer people will sign up and use it. But by creating less engaging resources, they provide less incentive for fans to bother signing up, creating a self-fulfilling prophecy."

Gender, Sexism and Racism in the Women's Tournament

3.03 The Middle

 Part 1:  The Middle

Putting the Dimensions of Class Together

All of the elements that we have been exploring combine to form a rough picture of social class.  There is not a universally accepted model for social class but income, wealth, education, location, prestige/power all can arguably play a part in determining class.

Using your knowledge of what the median American looks like, let's evaluate social class in America.  Think about these guiding questions as we go along today:

  • What are the different classes in the US?
  • Is there a middle class, and if so, what is it?

1.  After our introductory lessons to social class, what does the median American look like?  Please list the following median: 
wealth
income
education
location
prestige


2.   Knowing the median is the middle American (50th percentile), what is your opinion about how large should the middle class be?  That is, how much above the median and below the median should be considered the "middle class"?  (For example, should it be 80-20, 75-25, 60-40, or something else? And then what would you consider the other classes?  (There is no right answer here, just want to get you thinking.)


Gilbert's Model
Sociologists have used different models of social class to explain how social class disaggregates in the United States.  The table below is based on Hamilton College professor Dennis Gilbert's 1992 model of social class.  Look at the table and notice how Gilbert uses multiple measures (job, income, education)  to parse out the classes. 


3.  Which class do you think your family is, based on Gilbert's model?  Do all three components for your family fit his model?

4.  What do you think about Gilbert's model?  Any questions or criticisms?


Joan Williams' Model

Another model for the class structure is from Dr. Joan Williams who wrote the book White Working Class; Overcoming Class Cluelessness in America.

Dr. Williams' book came out of an article she wrote about the 2016 election posted here in Harvard Business Review.
Her article and her model of social class focus on these groups:

The "poor" class
  • the bottom 30% 
  • making less than 40K
  • median income of $22K
The "working" class
  • the middle 55%   
  • approx. $41K - $131K
  • median of $75K

The "professional-managerial elite" or "PME"
  • the top 14% on earners and at least one college degree in household
  • earns more than $131K per year 
  • median of $173,000
Dr. Williams explains that most Americans believe that they are middle class - whether they make $75K a year or $173K a year.  But these households have very different lifestyles and values, as she explains:


You can read her article here or watch her Ted Talk below.  The following TED Talk by Dr. Williams.  It is about 15min long, but it is insightful. 
Here is her Ted Talk:


5. After reading Williams' article posted here in Harvard Business Review or after watching the Ted Talk above, what do you think of her assessment of the contrast between the professional managerial elite class and the working class?  Do you understand why she is saying that this results in a political divide?

If you want to watch additional videos or a shorter one or see additional resources, check these out:

Other sociologists that support Joan Williams' thesis:


Robert Wuthnow's The Left Behind; Decline and Rage in Rural America

Princeton University sociologist, Robert Wuthnow explains the dynamic that Joan Williams describes in his book 
The Left Behind; Decline and Rage in Rural America that location has strongly affected how rural Americans feel and how they vote.  

Here is a 2018 interview with Professor Wuthnow from Vox.

What is fueling rural America’s outrage toward the federal government? Why did rural Americans vote overwhelmingly for Donald Trump? And, beyond economic and demographic decline, is there a more nuanced explanation for the growing rural-urban divide? Drawing on more than a decade of research and hundreds of interviews, Robert Wuthnow brings us into America’s small towns, farms, and rural communities to paint a rich portrait of the moral order — the interactions, loyalties, obligations, and identities—underpinning this critical segment of the nation. Wuthnow demonstrates that to truly understand rural Americans’ anger, their culture must be explored more fully. Wuthnow argues that rural America’s fury stems less from specific economic concerns than from the perception that Washington is distant from and yet threatening to the social fabric of small towns. Rural dwellers are especially troubled by Washington’s seeming lack of empathy for such small-town norms as personal responsibility, frugality, cooperation, and common sense. Wuthnow also shows that while these communities may not be as discriminatory as critics claim, racism and misogyny remain embedded in rural patterns of life.


Arlie Russell Hochschild's Strangers in their Own Land


In her 2016 book, Strangers In Their Own Land; Anger and Mourning on the American Right, renown sociologist Arlie Russell Hochschild explains the deep story behind the Tea Party support and the rise of Trump which stems from growing social class inequality happening at the same time as civil rights equality which leaves many White Americans feeling like they are left behind by the government and that they are "strangers in their own land."


What I found most intriguing in her book was the concept of the "deep story", or a story that shapes the way people feel.  It doesn't matter if the story is real or true or not.  What matters is that the story is believed to be true so people shape their feelings and actions as if it were real.  Dr. Hochschild's idea is explained on NPR's Hidden Brain

In her new book, Strangers in Their Own Land, sociologist Arlie Hochschild tackles this paradox. She says that while people might vote against their economic needs, they're actually voting to serve their emotional needs. Hochschild says that both conservative and liberals have "deep stories" — about who they are, and what their values are. Deep stories don't need to be completely accurate, but they have to feel true. They're the stories we tell ourselves to capture our hopes, pride, disappointments, fears, and anxieties.


Kohn and Lareau

Family shapes people differently based on the social class of the family.   In her book Unequal Childhoods, Annette Lareau explains that parents from working-class households emphasize following rules and discipline while upper-middle-class parents teach their kids to take risks, negotiate, and think creatively.  Lareau explains how these different parenting methods shape children from different social classes:

  • Upper middle-class families encourage negotiation and discussion and the questioning of authority and it can give the children a sense of entitlement.
  • Working-class and lower-income families encourage the following and trusting of people in authority positions, and these parents do not structure their children's daily activities, but rather let the children play on their own. This method teaches the children to respect people in authority, and allows the children to become independent at a younger age.

Lareau explains these differences in her research.  Her book, Unequal Childhoods is explained in the Atlantic here.  And there is an excerpt available here.


Lareau identifies these two styles:
Concerted Cultivation: The parenting style, favored by middle-class families, in which parents encourage negotiation and discussion and the questioning of authority, and enroll their children in extensive organized activity participation. This style helps children in middle-class careers, teaches them to question people in authority, develops a large vocabulary, and makes them comfortable in discussions with people of authority. However, it gives the children a sense of entitlement.
Accomplishment of Natural Growth: The parenting style, favored by working-class and lower-class families, in which parents issue directives to their children rather than negotiations, encourage the following and trusting of people in authority positions, and do not structure their children's daily activities, but rather let the children play on their own. This method has benefits that prepare the children for a job in "working" class jobs, teaches the children to respect and take the advice of people in authority, and allows the children to become independent at a younger age.
Student discussion:

Why do you think each social class shapes kids these ways?  Brainstorm your own hypothesis here.

Analyze either your family or a family you know - which style do you think they are and why?  Can you give a specific example?
Conclusions or questions about the reciprocal connection between education and income?


Wednesday, March 20, 2024

3.02 Wealth, Education, Location, Power and Prestige

Today's Lesson:
  • Besides income, what are the other components of social class?
  • What does the median/typical American look like in terms of wealth, education, location, power and prestige? 
  • How does your family or the typical family from your hometown compare to the typical US household?
  • How do all of these components affect each other?

Social Class Component 2: Wealth 

Wealth is tricky to understand.  It is everything that a household owns, such as the home, vacation home, cars, 401K, savings, stocks, jewelry, etc...But, you must subtract what the household owes.  So, if my house is $200,000 but I owe $160,000 then my wealth is only $40,000 on the house.  


Wealth Disparity in the US

One way to examine wealth is through quintiles (20% increments);  If you lined all the households up in the U.S. by their wealth, what percentage of the total wealth would the top 20% own? And then the next 20% and so on...

Another way to think about this is if you have 5 people who are sharing a pie, what percent of the pie does the first person get, and the second person and third, etc...
CBS explains wealth with a pie here.


Try the following exercise on your own:

First, hypothesize, how much of the wealth (the pie) in the U.S. do you think each quintile (person) has:
Bottom 20%:______   2nd 20%_______  3rd 20%________  4th 20%_______ 5th 20%_______Top
(least)                                                                                                                                (most)

Second, write how much you think each quintile should have?
Bottom 20%:
Bottom 20%:______   2nd 20%_______  3rd 20%________  4th 20%_______ 5th 20%_______Top
(least)                                                                                                                                (most)


After you have finished answering the questions above, watch this video:


What is the reality?  How is the wealth actually divided?

Here is the GOOGLE FORM for this Lesson.
1.  How does your guess about wealth compare to how it is actually distributed?   


Wealth in the US is more disparate than income!  The inequality is shocking:


Here is another representation:
Wealth is so skewed that there is a 2022 Socius article devoted to explaining how difficult it is to visualize the disparity here. This is a graph of the bottom 99% of Americans:


This video from the ST. Louis Fed also explains the disparity in wealth in the US (2019).


The overall conclusion about wealth is that the disparity of wealth is greater than that of income (see the pie graph below).  The top 1% of America owns 34% of everything.  The top 10% owns 70%.  And half of America owns 96% of everything.  In other words, the bottom half, 50% of America, owns almost nothing.  They have no money saved - for retirement or otherwise.  Once you deduct their debts, they have almost no equity - from their homes, or possessions, or bank accounts.  


Another way to see the disparity from inequality.org is that the three wealthiest Americans own more than the bottom fifty percent combined!


Wealth Disparity is Growing
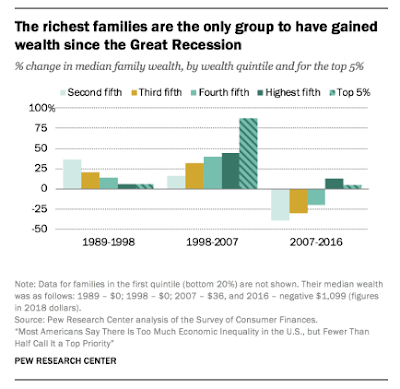
Similar to income, the disparity on wealth has been growing:

Here is the wealth distribution in the US from 1990 to 2021 from Statista - note the blue line which has been growing since 1990:

The PEW shows trends in wealth and income 2020:


More wealth leads to more income and less taxes
The biggest way that wealth adds to social class is through passive income.  The wealthiest Americans own investments that generate income for them such as stocks, real estate, and securities.  Often, money earned through these investments is taxed at a lower rate than direct income.  So, if you have enough money to invest and make even more money you are able to make even more money for less taxes, whereas, people who are working for a set salary and living paycheck to paycheck are often paying 20% more in taxes. 


The wealth of a typical American

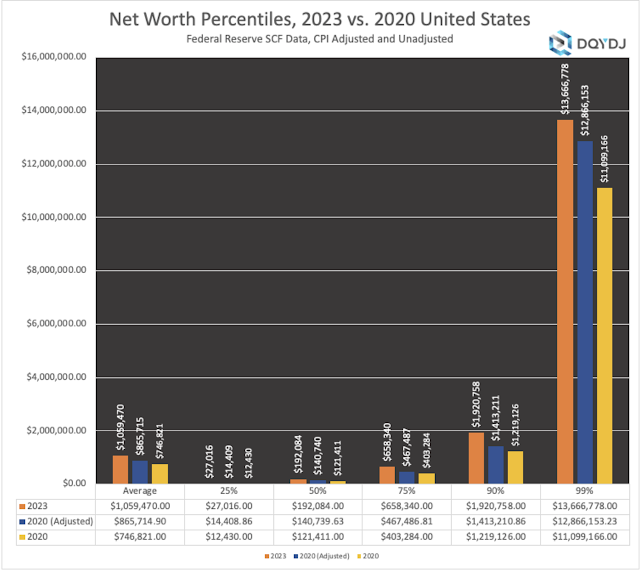
The DQYDJ analysis of wealth in America calculates the median net wealth for Americans at $192,000 in 2023:


Another estimate of the wealth (2019) of Americans from the Aspen Institute provides a detailed analysis of the different assets of wealth that Americans hold based on their relative position:


It might be difficult to know how much wealth your family has, so here is a different way to think about it from Statista:   
2.  How does your family's wealth compare to the average American?  Feel free to comment on any of the above stats, or a combination of them.


For a much more detailed analysis of wealth, see this post from business insider which explains the wealth by demographics like age, race, and two components of social class that we will examine next: education and location.


Social Class Component 3: Education 

Without looking, what percentage of U.S. adults do you think have a college degree?

Here is a link to the Census data regarding education where you can search by municipality or zip code to see what the median educational level is.


4.  Did you realize that so few people have a bachelor's degree or higher?  Does any of this surprise you?


5.  Where does your family fall in terms of educational level? The median American educational level is some college, but no degree.  Is the educational level in your family higher or lower and by how much?


Parent Education = Children's Future Education 

Parents' educational levels correlate with children's educational attainment.  The graph below shows that the less education that parents have, the less education their children obtain.  In other words, if parents don't have a college degree, the child is not likely to attain a college degree and visa-versa; parents with an advanced degree are more likely to have children who attain an advanced degree themselves.


Below is another way of showing the educational level of parents (on the left) influences the level of college education their children get (center) and what social class the children end up in (right) from Daniel Laurison on Twitter:


6.  What are some conclusions or questions you have about how parent educational level affects children's educational probability?


Education = Income

Not only is education level stratified, but the family's educational level determines, on average what the family's income will be (on average).   In other words, the higher your education is, the more money one is likely to earn.  Link to College Board 2016 research report here.  The graph below shows how median income goes up for each level of education, even if you factor in income taxes (which also go up):


Here is a 2011 post from sociological images that has a lot of info showing the connection between your degree and your income, especially that more than any other factor, educational level contributes to lifetime income earnings and the earnings gap gets wider over time.


Income = test scores


So, not only does more education mean more income, the more income means higher scores on standardized tests (which could mean a better education).  See the data below.  This link shows that on average, the higher a family's income, the higher the ACT score.

7.  What are some of the reasons that higher-income might lead to higher test scores?


Higher Income = More Elite College (from no college all the way to the Ivies)

People from different social classes are more likely to interact together at college.  From The Upshot of  NY Times, this interactive site allows you to see what percent of students from the top 1% and bottom 60% attend each school of higher education.  You can click on the link above to search your own schools and see more data, but below are two images from the link.

First, this image shows in general that the more income a family has (left side y-axis), the more elite the school that their kids attend:


And the list below shows how schools rank in terms of students from the top 1% of income compared to the number of students from the bottom 60%:


Not only is educational level shaped by parents' social class, but even the major that a student chooses is too.  This research from Natasha Quadlin shows that the major a student chooses at college is influenced by social class,
"...income gaps between fields are often larger than gaps between those with college degrees and those without them. Natasha Quadlin finds that this gap is in many ways due to differences in funding at the start of college that determine which majors students choose....She finds that students who pay for college with loans are more likely to major in applied non-STEM fields, such as business and nursing, and they are less likely to be undeclared. However, students whose funding comes primarily from grants or family members are more likely to choose academic majors like sociology or English and STEM majors like biology or computer science."


Matchmaking and Education

Besides the likelihood of meeting friends and potential spouses at college, there are specific apps and websites to help matchmake couples from Ivy League+ schools.  This 2019 Harvard Gazette article reviews three of them including:  
  • BluesMatch, a company based in London that matches Oxford, Cambridge, and Ivy League graduates, said it makes sense that as people experience search fatigue from broad, impersonal online dating pools, they’re drawn to sites that narrow the field by matching users’ interests or backgrounds. “People get tired of using Tinder or Match because there are too many people,” said Law during a Skype chat from London. “And they often don’t have the level of conversation that someone from Oxford or the Ivy League gets excited by.”
  • Elegant Introductions out of Miami, are matchmakers for a clientele based in Miami and Boston. Most of their clients, said Gold, are highly educated and professionally successful, are involved in their community, appreciate the arts, and have been screened to make sure they are who they say they are. Applicants have to show proof of an Ivy League degree.

Additionally, if you are interested:

Elite Colleges Constantly Tell Low-Income Students That They Do Not Belong from Clint Smith in the Atlantic.


How Admissions Really Work: If The College Admissions Scandal Shocked YouRead this from NPR.
There are lots of ways that wealthy families get a boost in the college admissions process. Most are quite legal.

Paul Tough's book, The Years That Matter Most is a deep-dive sociological look into college and social class.  From the NY Times book review
"... today, whether you graduate from college is largely determined by your parents’ income. In the United States, 77 percent of children born into the top income quartile will earn a degree by age 24, but for the bottom quartile that number is a mere 9 percent. The implications are clear: The education system isn’t transforming the lives of those who need it most; it is dispensing ever more opportunity to those who need it least."


Social Class Component 4: Location

The next component of social class is location.  

The Median Metro Area
Examining 
the largest 384 metro areas in the United States, Chicago is the 3rd most populous at 9 million people.  There are different ways to measure the median metro area, but regardless of how it’s done, it is substantially smaller than Chicago.   Examining the median individual American, they live in a  metro area closer in size to the 50th metro region such as Fresno, CA, Grand Rapids, MI, Rochester, NY or Tulsa, OK, just above 1 million people. However, the median metropolitan area is Yakima, WA or Baldwin County, AL.  Either way, the typical American lives in a small city - much smaller than the Chicago metropolitan region.  And this geographic disparity of location is connected to income and class.


8.  What is the size of the median metro area in the United States?

9.  How does our metro area compare to the median?


Location and where College Grads Move
WSJ data shows where college grads are likely to move after they graduate.  Here is one example of where LUC grads move:
This post explains more detail about the WSJ data above and how location and education are related.


Try to make your own conclusions about the data:

10.  Where do college grads tend to move?

11.  How do you think where college grads move affects social class in the U.S.?


Educational Attainment in America Map

Another source of evidence regarding social class, education and location is The American Community Survey Map (pictured below).   

The map shows that there are clusters of people with the same levels of education living together.  Take a look at the clusters of green and blue near cities from this zoomed out perspective of America:


Here is northern Illinois  - note the clusters of different levels of education:


And Chicago's northside shows that educational segregation on a neighborhood level:


12.  Where do you see segregation by educational attainment? 


 This article by Business Insider highlights some conclusions about educational segregation based on the interactive version of the map above.


Home Price, Location and Social Class

The price of a home depends on a lot more than the physical structure of the home. 
From Business Insider, the average home price varies considerably from state to state. For example, Zillow’s Home Value Index (2023) puts the median home value in the US at $350,113. But West VA was the lowest with an average home value of $158K and Hawaii was the highest at $971K followed by California at $760K. The value for Illinois was $255K. Location matters.

Extra Data about Home Price:


Location and home price:


13.  How do you think your home's value compares to the average home price?  (Remember from the wealth section above, the average American owns a home.)


Location and health

Research from  Melody Goodman, an assistant professor at Washington University in St. Louis presented at Harvard School of Public Health shows that zipcode is a better predictor for health than genetic code:

Residents to the north of Delmar are less likely to have a bachelor’s degree and more likely to have heart disease or cancer.

More recently, Damon Tweedy from Health Affairs summarizes new research from David Ansell, senior vice president and associate provost for community health equity and a professor of medicine at Chicago’s Rush University Medical Center,

Headlines portray Chicago, Illinois, as the epicenter of urban gun violence. But most premature deaths among Chicago’s black residents are caused by heart disease, diabetes, and cancer. In his new book... Ansell asserts that structural violence is the true cause of the dramatic...differences in death rates and life expectancy across Chicago neighborhoods. According to Ansell, this form of violence—rooted in past and present social, economic, and racial inequality—saps the lives of residents in poor neighborhoods and results in the death gap. Chicago, in this narrative, is a microcosm of America. 

In this new book, he takes a larger view, focusing on how factors outside of the health care system—neighborhood segregation, in particular—affect health. 

The death gaps are indeed striking: For example, in 2010 the life expectancy in the affluent Hyde Park section of Chicago was eighty-three, but less than a mile away, in Washington Park, it was sixty-nine. Ansell offers similar comparative data for other neighborhoods in the Chicago area as well as in many other metropolitan settings across America. “Those statistics reflect averages,” Ansell writes, “but every death from structural violence is a person.”

And Clint Smith, a Washington DC teacher explains in his slam poem the ways that location affects his students.  As you watch, make a list of the ways that location affects them:


Location is also related to mobility:

An online data tool called Opportunity Atlas finds a strong correlation between where people are raised and their chances of achieving the American dream.
Here is an NPR piece explaining it.
Here is the NY Times Upshot explaining it.
Opportunity Insights provides data about how neighborhoods shape residents' life chances.
Here are maps showing the wide variation of opportunity from the national to the local levels:


This report from NPR's Planet Money details how where you grow up can affect your income later in life.

And here is a video and stats from CNN Money that show how where you grow up limits or benefits you.


  • What does the median or average American look like in terms of social class?
  • How does this compare to your own unique experience(s)?
  • How do all of these components of social class connect to each other to either limit or advantage those in them?


Social Class Component 5: Prestige and Power

People view different occupations with different levels of prestige.  This prestige can translate to real power such as being appointed to boards or committees.  It can also simply give you credibility or respect in social situations.  


What is the median prestige job in this data?  

Where does your family's prestige rating fall compared to this?

Power, according to Max Weber, is the ability to impose one's will on others.  Weber focused on three ways that power shows up in everyday life:
  • Traditional authority - power because of social or cultural tradition like royalty or religious leaders
  • Rational-Legal authority - power from law and legitimacy of the state such as judges and police 
  • Charismatic authority - power that comes from personal qualities that create influence over people such as Kim Kardashian or Michael Strehan
One example of power is how the world's most powerful leaders gather in secret meetings annually to discuss how they can shape policy, economics and laws among other things. One such meeting is the American Enterprise Institute is one example of an annual meeting which is a private, off-the-record meeting held every year.  Another meeting is the Bilderberg meeting.

Some examples of power are the abilities to keep yourself out of jail, influence politicians and enact laws that you favor:

Here is one example from The Daily Show comparing teachers and Wall Street Investors.  Can you guess who has the power?  Video is available at Youtube here.

Here is a link to a Washington Post article explaining that wealthy Americans use their power to create favorable government policies.

This 2019 ProPublica report found that the IRS is LESS likely to audit wealthier Americans because it is more costly and difficult.

And this article from the NY Times shows that an executive at United Airlines accused of corruption charges was forced to resign. Imagine if a teacher was accused of corruption and was forced to resign. That would be it - out of a job and no compensation. But,
United filed a report with the Securities and Exchange Commission on Tuesday indicating that Mr. Smisek would receive nearly $4.9 million in a separation payment, and 60,000 shares of stock, valued at over $3 million.

Some more local examples of a contrast in power among wealthy and powerful compared to low income and powerless:

Compare this story to the cheating scandal in the video above.
Check this post for an explanation of drug busts at different schools including here.

Choose one of the examples above.  Which did you choose and what is the power being exerted?