https://gephi.org/
Gephi is a tool for data analysts and scientists keen to explore and understand graphs. Like Photoshop™ but for graph data, the user interacts with the representation, manipulate the structures, shapes and colors to reveal hidden patterns. The goal is to help data analysts to make hypothesis, intuitively discover patterns, isolate structure singularities or faults during data sourcing. It is a complementary tool to traditional statistics, as visual thinking with interactive interfaces is now recognized to facilitate reasoning. This is a software for Exploratory Data Analysis, a paradigm appeared in the Visual Analytics field of research.
From http://sna433.weebly.com/network-analysis.html:
I learned 3 major things from visualizing and analyzing my social network:1. I have a few important central nodes and connectors. For example, I have 68 common friends with my best friend2. I have a large community of UBC friends and smaller communities within this network. For example, I have friends from Jump Start (leadership program for 1st year intl students), friends I know from Marine Drive, classmates, UBC clubs and other communities within my large UBC cluster.
3. This graph helped me to easily detect outliers and people I don't have close connections with (Perhaps, I know how to easily clean my Facebook friends now?)

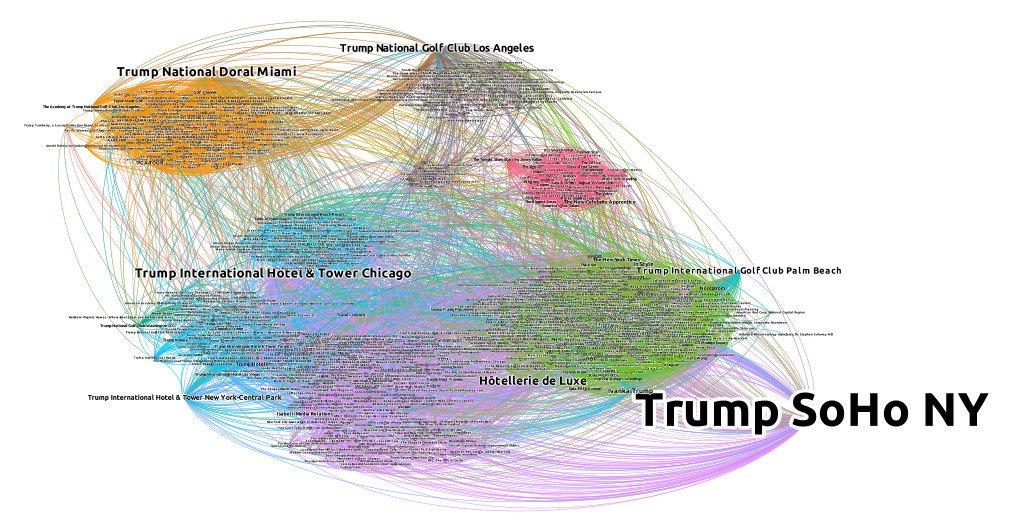
From http://forum-gephi.org/viewtopic.php?t=5905 :
this is a graph i made yesterday with the network of facebook pages "friends" of Donald Trump. As you can see, i would like to show some labels, just the most important

No comments:
Post a Comment